Data visualization is a key component of building a data compilation. We strive to visually present data in a manner that can almost speak for itself.
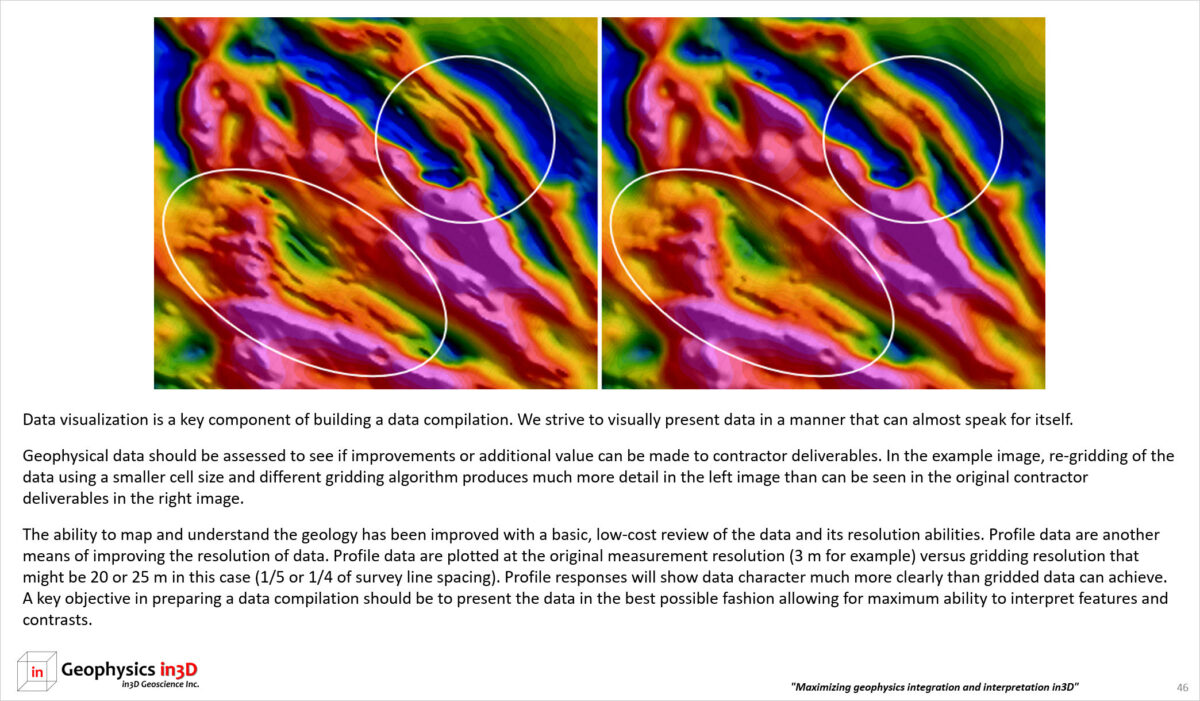
Geophysical data should be assessed to see if improvements or additional value can be made to contractor deliverables. In the example image, re-gridding of the data using a smaller cell size and different gridding algorithm produces much more detail in the left image than can be seen in the original contractor deliverables in the right image.
The ability to map and understand the geology has been improved with a basic, low-cost review of the data and its resolution abilities. Profile data are another means of improving the resolution of data. Profile data are plotted at the original measurement resolution (3 m for example) versus gridding resolution that might be 20 or 25 m in this case (1/5 or 1/4 of survey line spacing). Profile responses will show data character much more clearly than gridded data can achieve. A key objective in preparing a data compilation should be to present the data in the best possible fashion allowing for maximum ability to interpret features and contrasts.
Key takeaway: know your data, maximize its inherent value.

