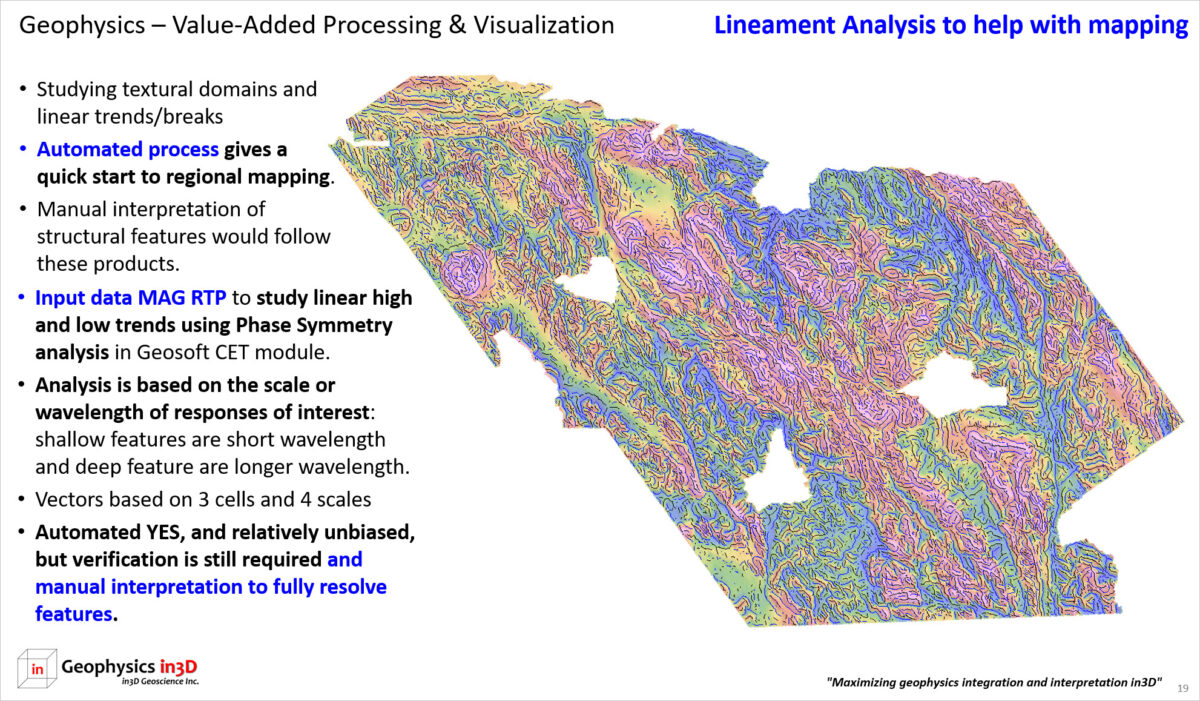
Automated and manual lineament analysis is a helpful tool in using geophysics to assist geologic mapping. In the following examples lineament analysis was conducted using phase symmetry analysis in the Geosoft CET module. The analysis is based on the scale or wavelength of responses of interest and was performed on the magnetic highs and lows. Automated lineament analysis is relatively unbiased, but verification is still required and additional manual interpretation is recommended to fully resolve features.
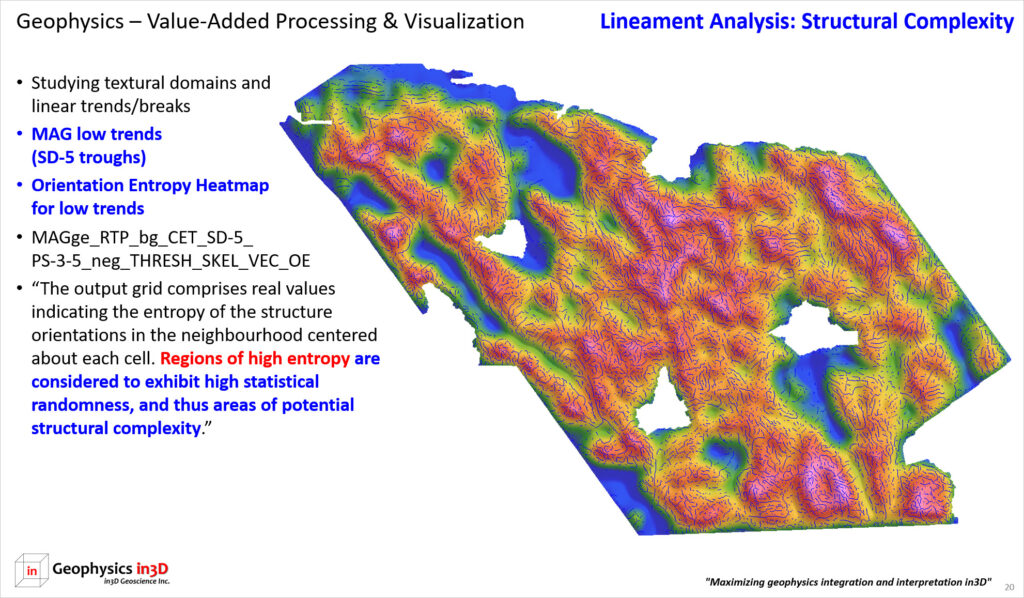
The image below is the assessment of structural complexity. Regions of high entropy are considered to exhibit high statistical randomness and thus areas of potential structural complexity. The black lines are magnetic low lineaments the colour grid is the orientation entropy Heatmap for magnetic lows.

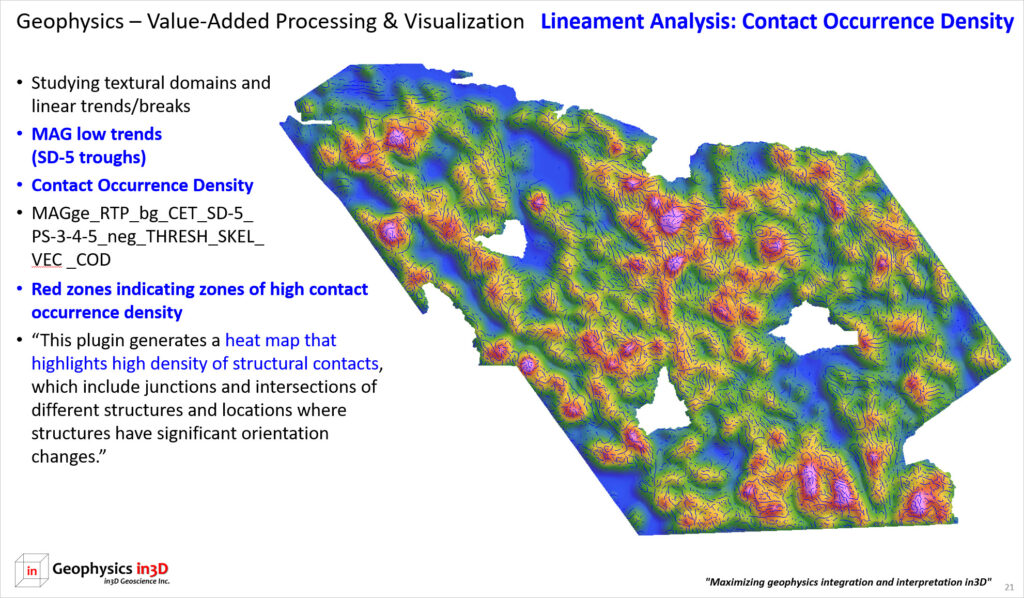
Contact occurrence density generates a heat map that highlights regions of high density of structural contacts. This includes junctions and intersections of different structures and notes locations where structures have significant orientation changes.


